

Charts
The black titration curve, which represents the titration of a strong acid (HCl) with a strong base (NaOH) has a lower equivalence point than the green titration curve. Since hydrochloric acid is a strong acid, all H atoms deprotinate and form hydronium ions, which react with hydroxide ions when NaOH is added. Because acetic acid is a weak acid, the acetate ion that dissociates serves as a strong conjugate base in the solution, leading to a slightly higher pH value at the equivalence point.
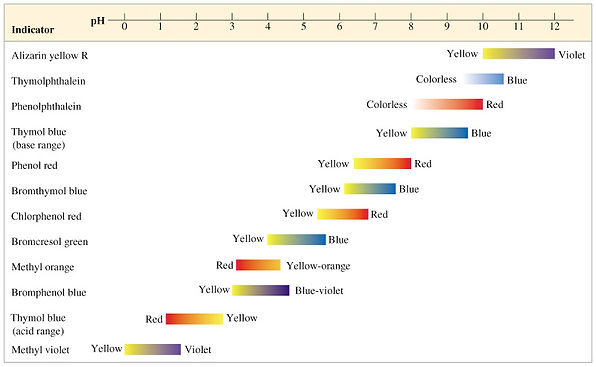
This table of indicators lists the pH values at which the indicator changes color, which can represent the end point of a titration. (Look at the titration video so the indicating of the endpoint can be demonstated!!)
The following video explains how to calculate for the unknown concetration in an equilibrium setting